Viewing Results
This guide shows examples of Kexa scan results across different output formats and visualization tools.
Configuration: For setup instructions, see Configuration and for notifications see Notifications.
Console Output
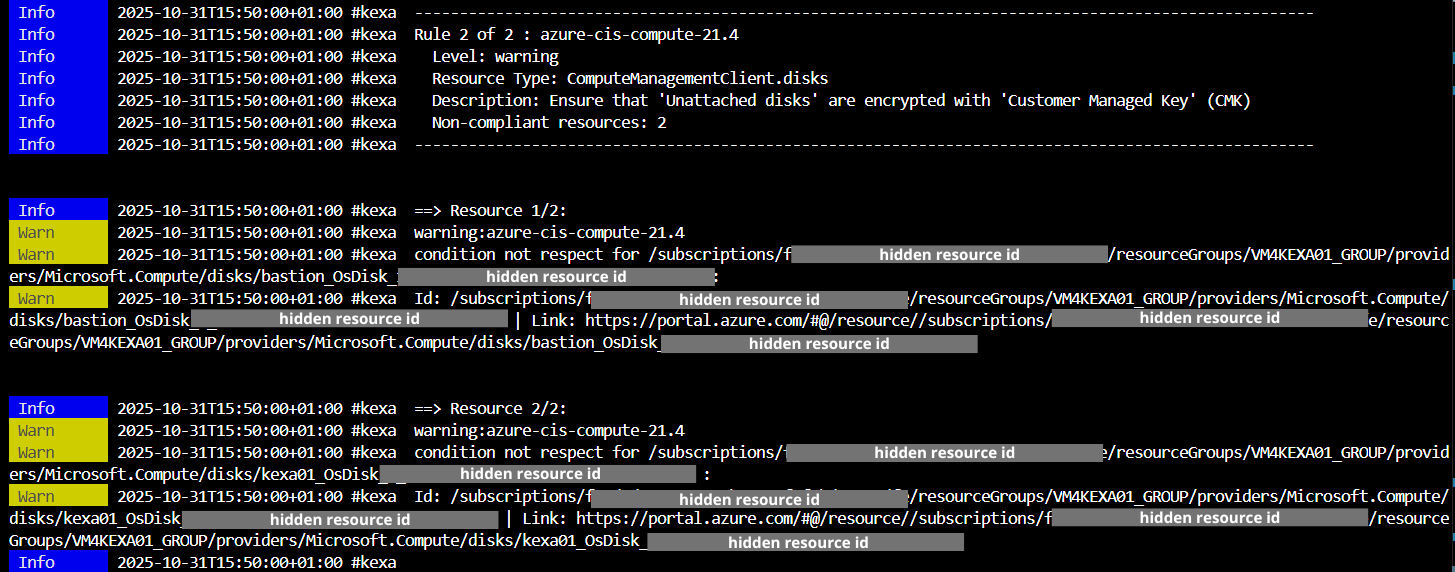
The console displays real-time scan progress with color-coded severity levels and completion statistics.
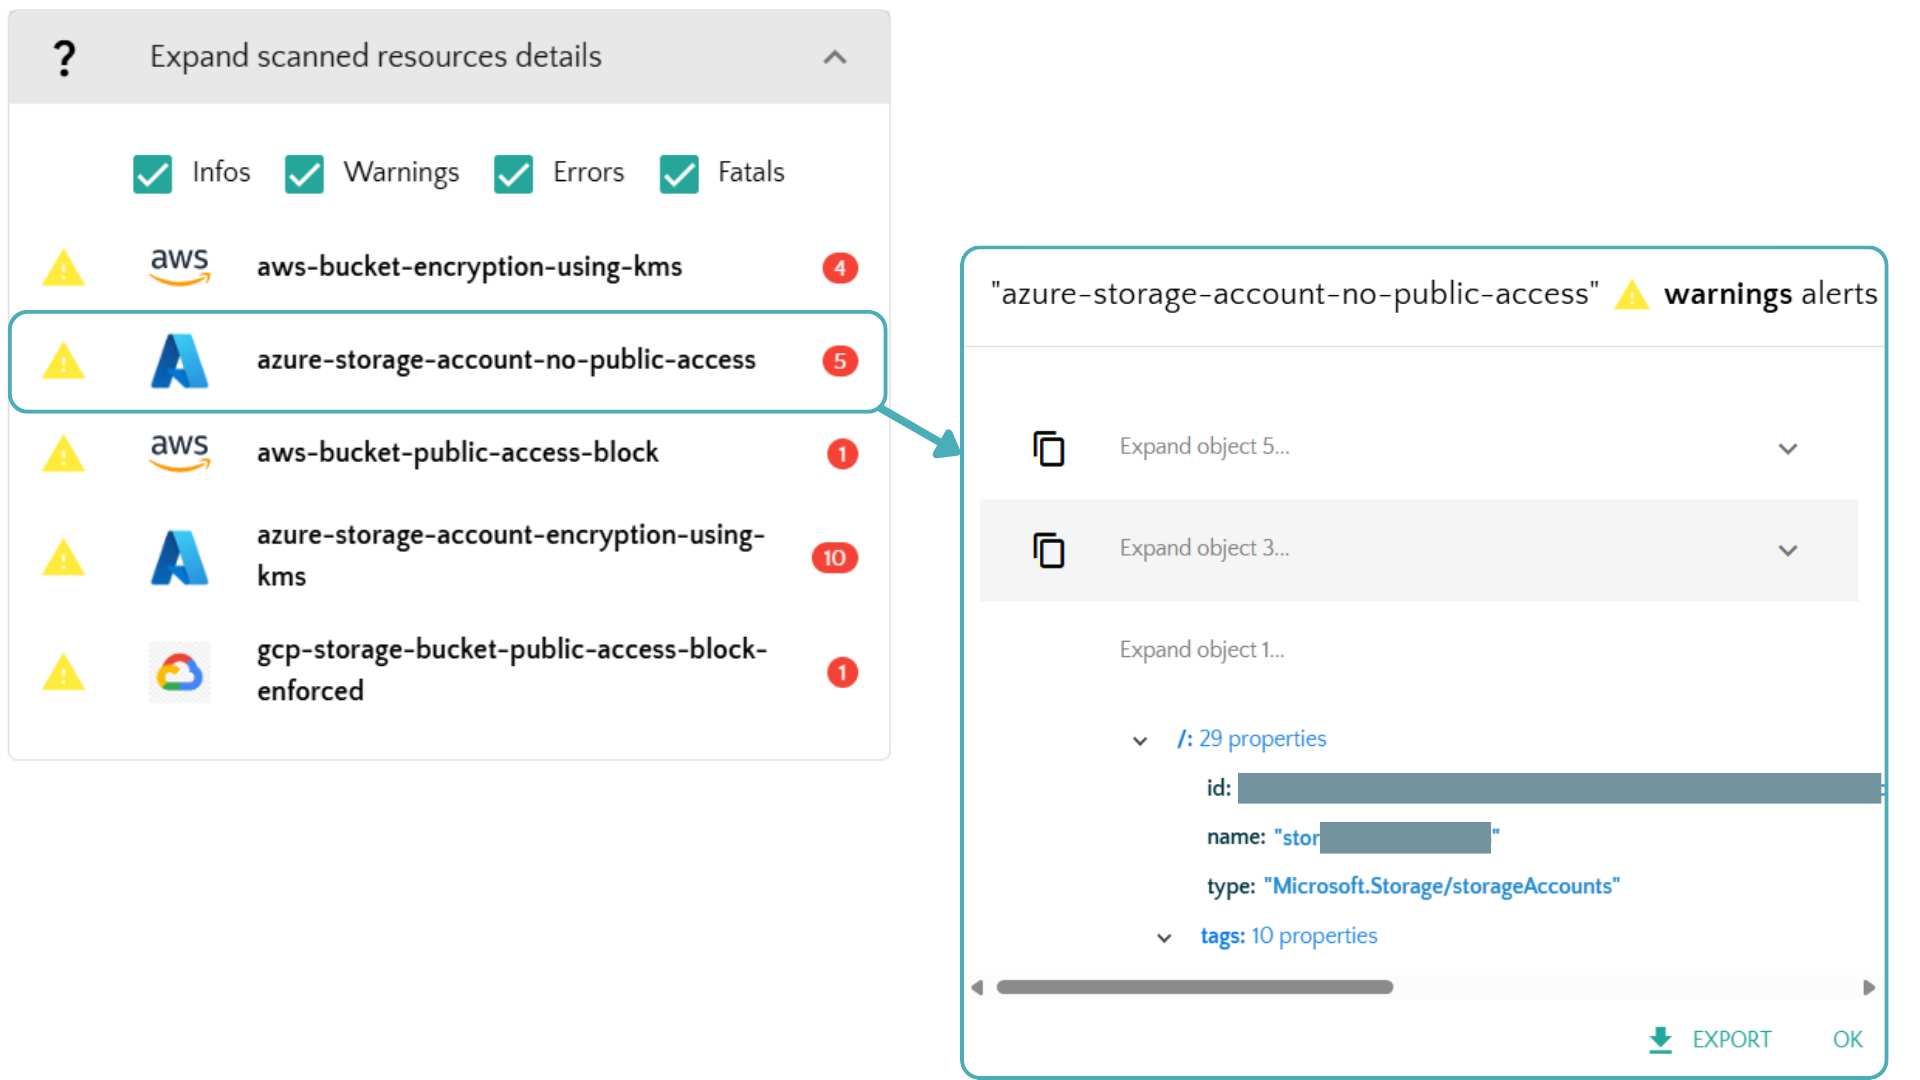
HTML Reports
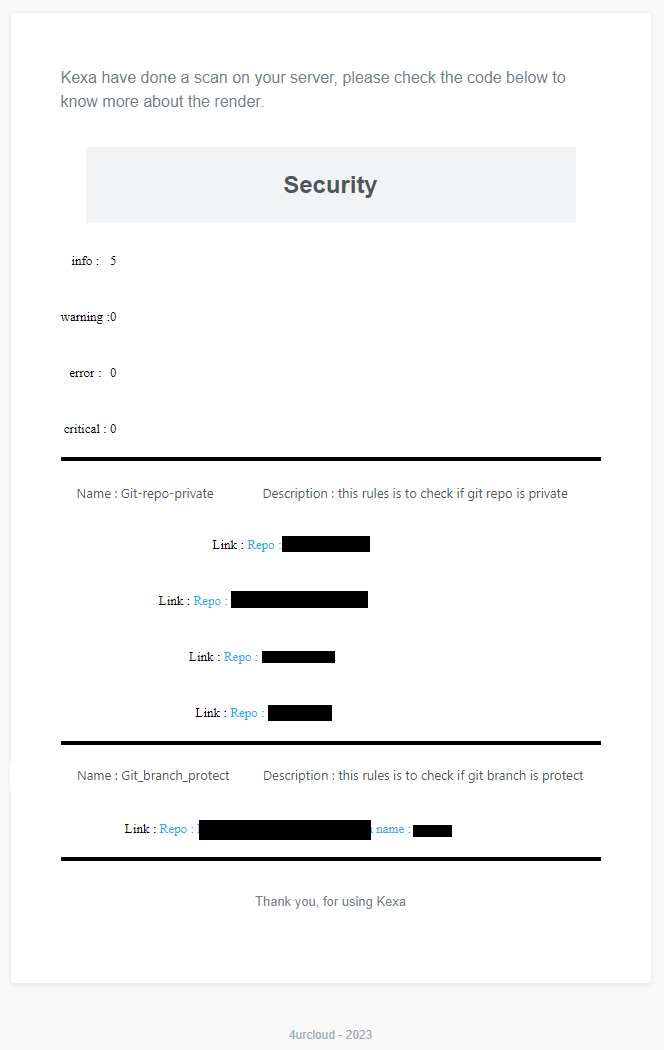
HTML reports are automatically generated in the /output/scans/<environment>/<YYYYMMDDHHmm>.html folder with:
- Summary of all error levels (info to critical)
- Detailed rule violations and affected resources
- Clickable links to resources (when available)
- Resource identification details
JSON Output
Resources Output (-g / --gather)
You can generate JSON output files for programmatic access to gathering results with the argument -g or --gather.
The JSON files contain structured data about all the information collected during the scan.
When this flag is used:
- JSON is written to file:
/output/resources/<YYYYMMDDHHmm>.json - JSON is also written to stdout for piping to other tools
The output has the following structure:
{
  "<providerA>": [
	{ // Environment 1
		"<resource_type1>": [
			{} // actual resource data
		],
		"<resource_type2>": [
			{}
		]
	},
	{ // Environment 2
		"<resource_type1>": [
			{}
		],
		"<resource_type2>": [
			{}
		]
	}
  ],
  "<providerB>": [
	{ // Environment 1
		"<resource_type3>": [
			{}
		]
	}
  ],
}
Alerts Output (-a / --alerts)
You can generate JSON output files for scan results with errors using the argument -a or --alerts.
When this flag is used:
- JSON is written to file:
/output/alerts/<YYYYMMDDHHmm>-alerts.json - JSON is also written to stdout for piping to other tools
- Results are grouped by rule with associated resources
The output structure:
{
  "timestamp": "2025-10-31T13:00:00.000Z",
  "rules": [
    {
      "name": "rule-name",
      "description": "Rule description",
      "level": 2,
      "cloudProvider": "azure",
      "objectName": "virtualMachines",
      "resources": [
        {
          // Resource data that failed the rule
        }
      ]
    }
  ]
}
Output Destination (--to)
Control where JSON output is written using the --to flag (default: both):
# Write only to file (clean console logs)
kexa -g --to file

# Write only to stdout (no file creation)
kexa -g --to stdout
Silent Mode (-s / --silent)
For automation and clean JSON output, use the -s or --silent flag:
# Export resources with clean JSON output (no logs)
kexa -g -s

# Export alerts with clean JSON output
kexa -a -s

# Combine with --to for more control on output destination
kexa -g -s --to file
kexa -g -s --to stdout

# Pipe to jq for filtering
kexa -g -s | jq '.azure[0]'
# or for powershell :
kexa -g -s | ConvertFrom-Json | Select-Object -ExpandProperty azure | Select-Object -First 1
When silent mode is enabled:
- All log output is suppressed
- Only JSON from
-gor-ais written to stdout - Errors are output as JSON to stderr in the format:
{
  "level": "error",
  "message": "Error message",
  "timestamp": "2025-10-31T13:00:00.000Z",
  "namespace": ["kexa"]
}
Notification Examples
Microsoft Teams
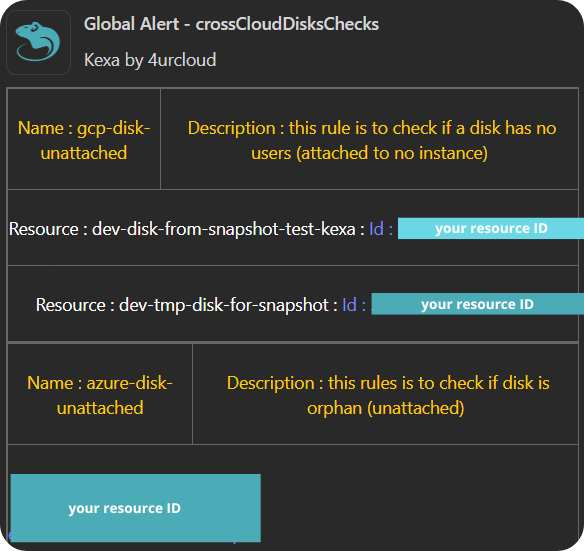
Teams notifications show scan summaries with issue counts and resource links.
Jira Integration
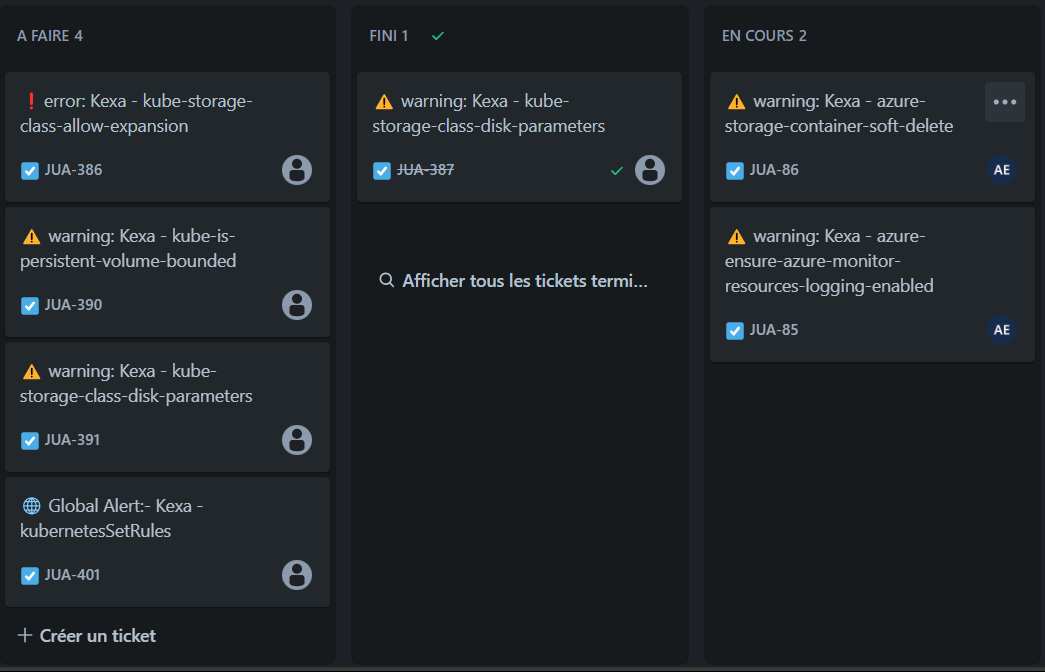
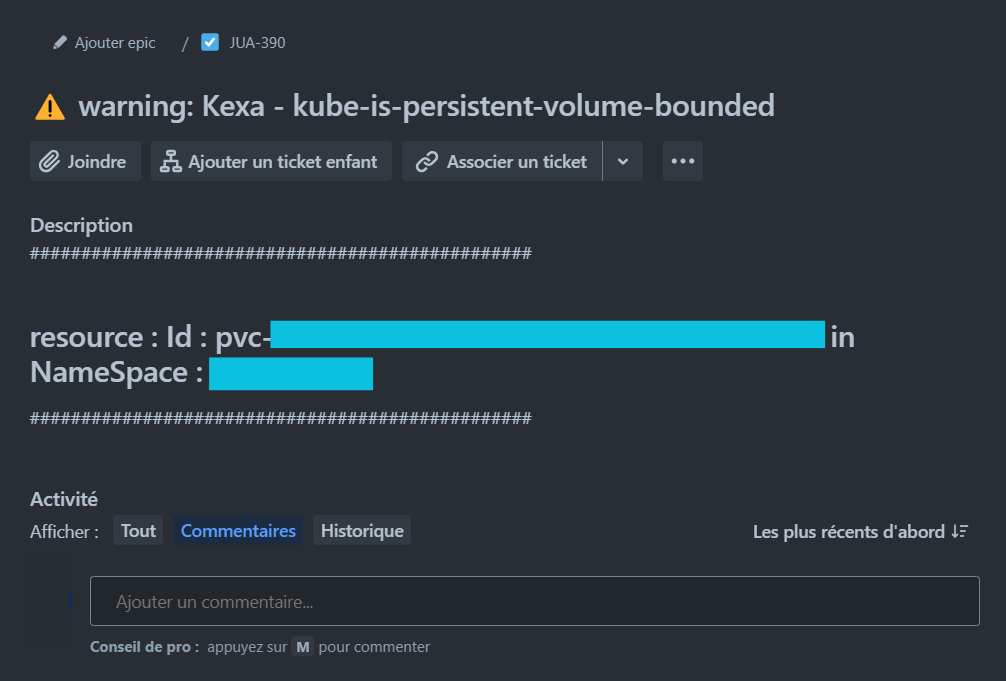
Jira automatically creates tickets with rules description and associated ressource.
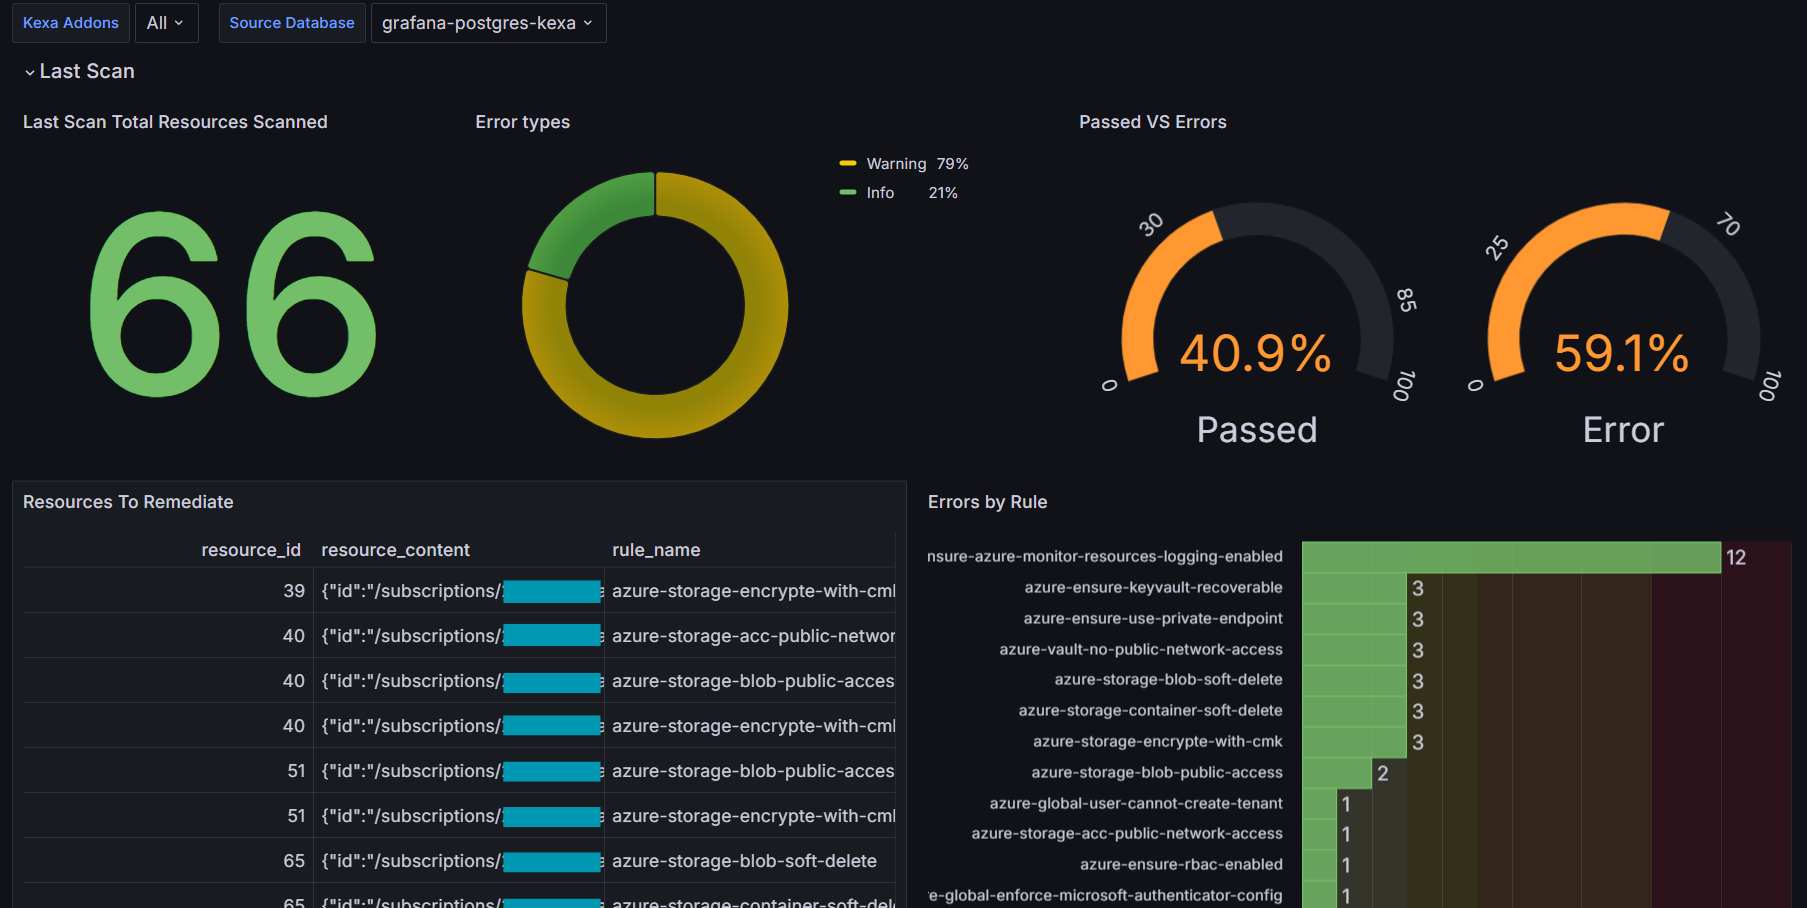
Grafana Dashboards
Main Overview Dashboard
Kubernetes Dashboards
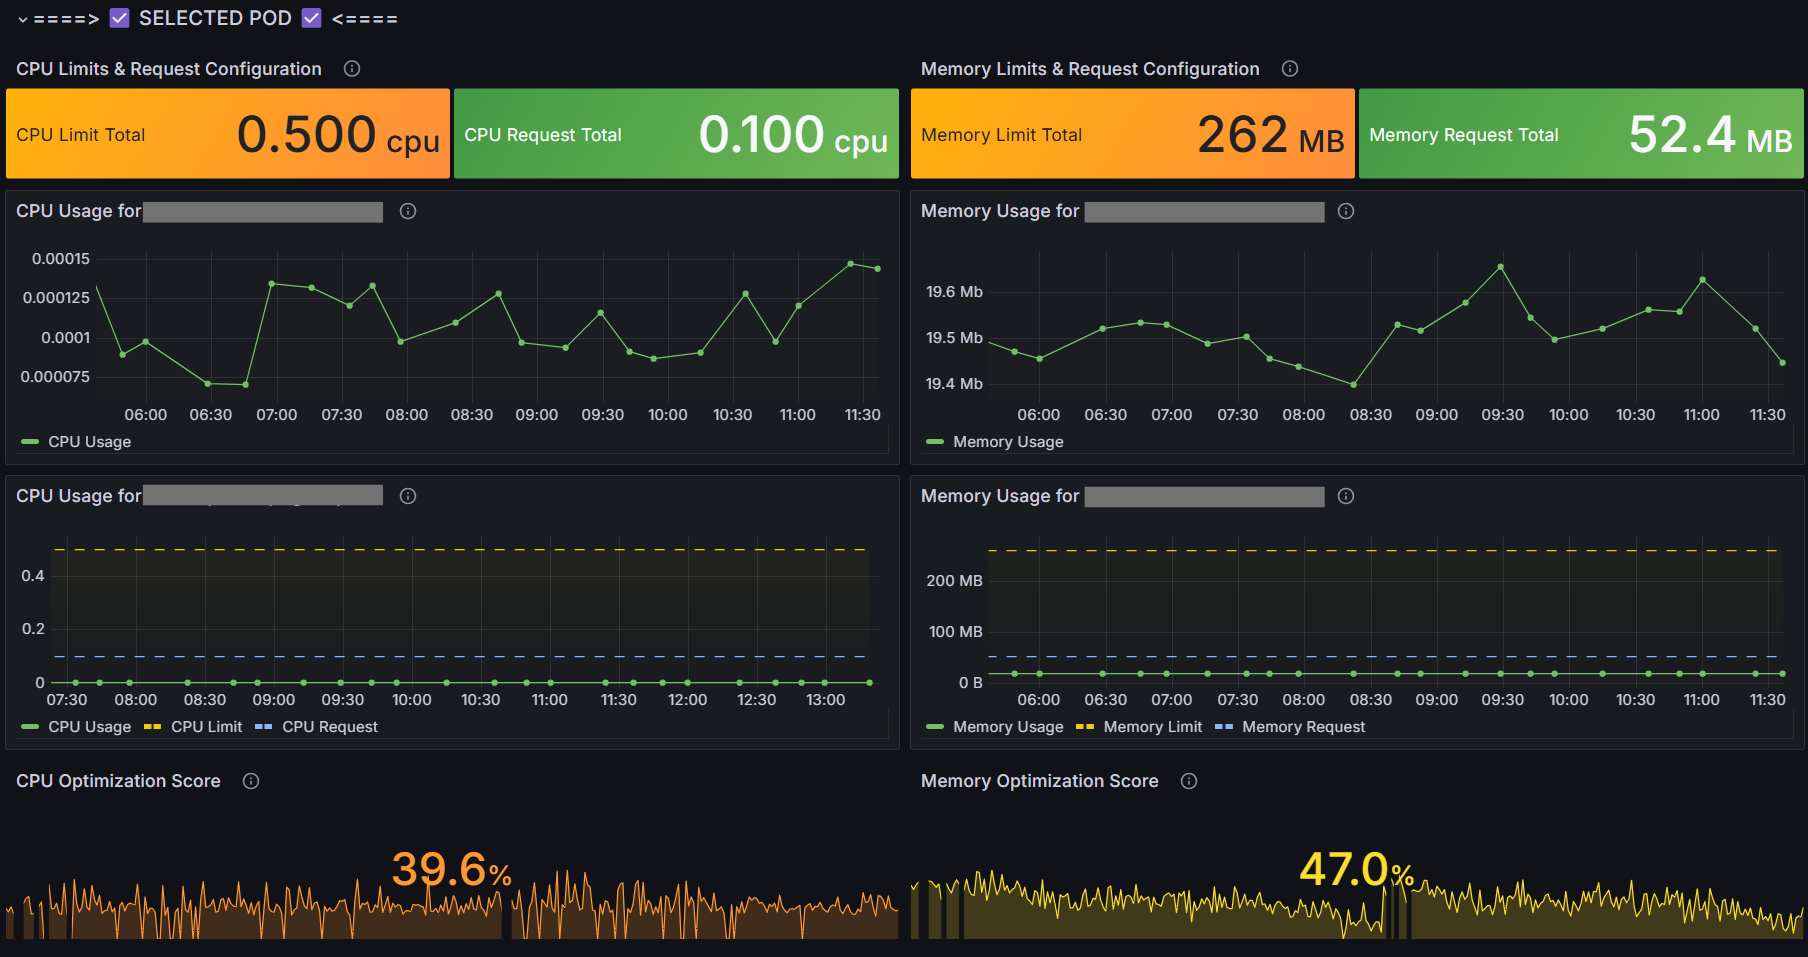
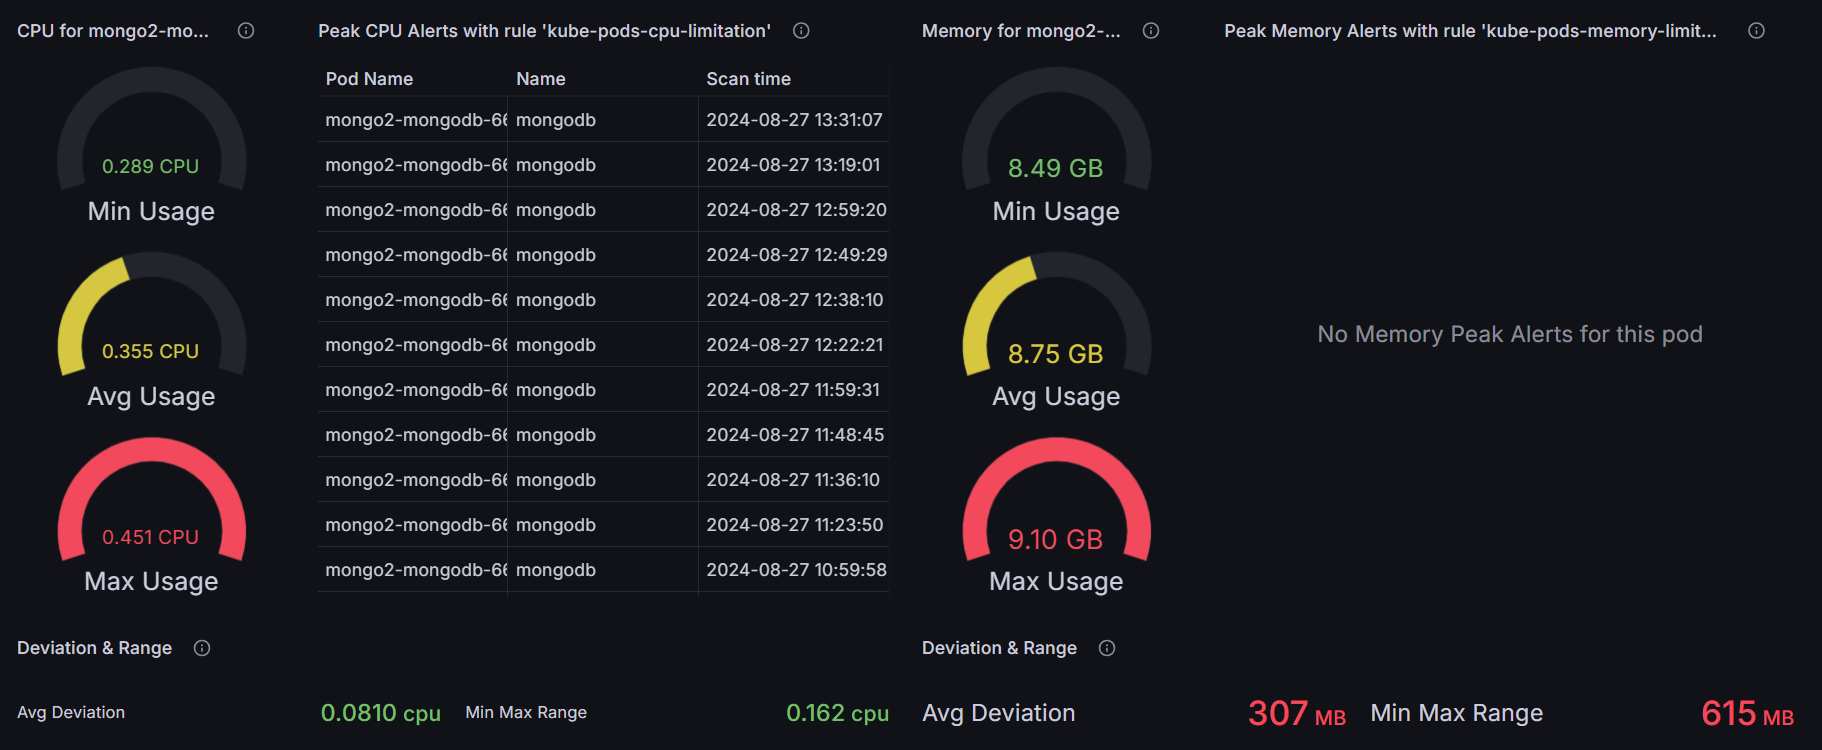
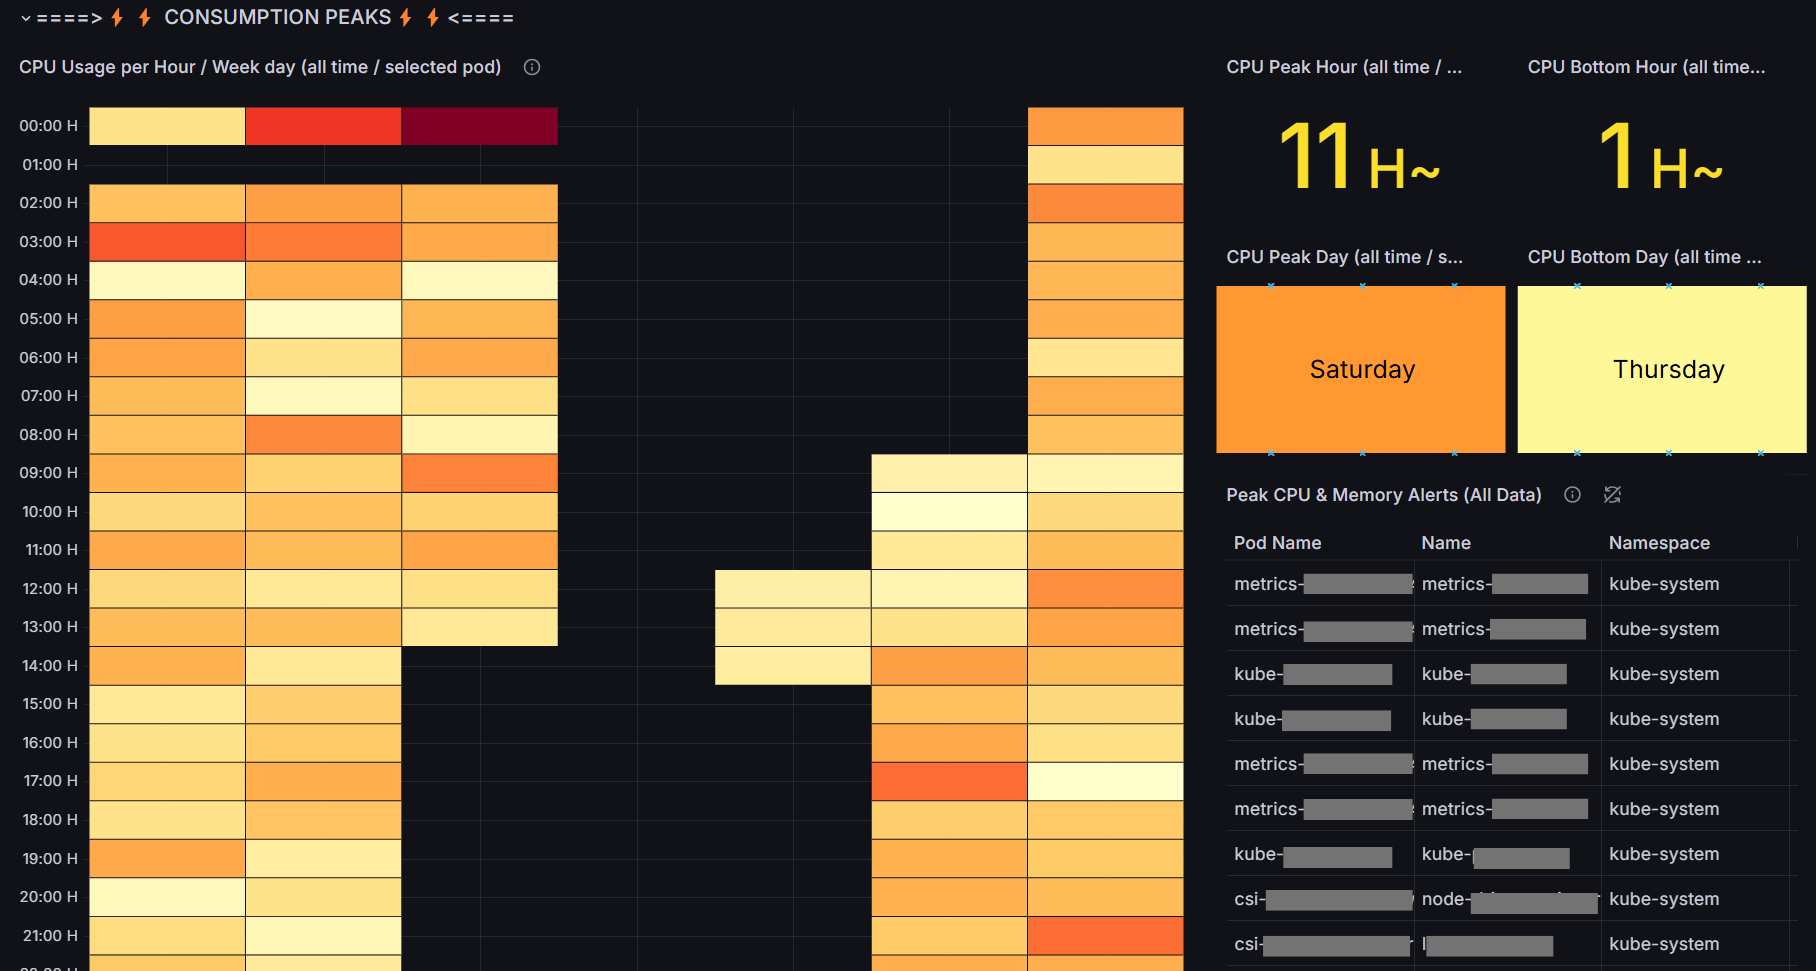
Kubernetes-specific visualization showing CPU/memory utilization and optimization opportunities.
SaaS Dashboard
Detailed web interface to see all your scans history and alerts as well as your gathered cloud ressources, with direct link to ressource when possible.
Severity Levels
Example of use :
| Level | Name | Color Code | Examples |
|---|---|---|---|
| 0 | Info | Blue | Status updates, resource counts |
| 1 | Warning | Yellow | Optimization opportunities, unused resources |
| 2 | Error | Orange | Security violations, compliance issues |
| 3 | Fatal | Red | Critical vulnerabilities, service disruptions |